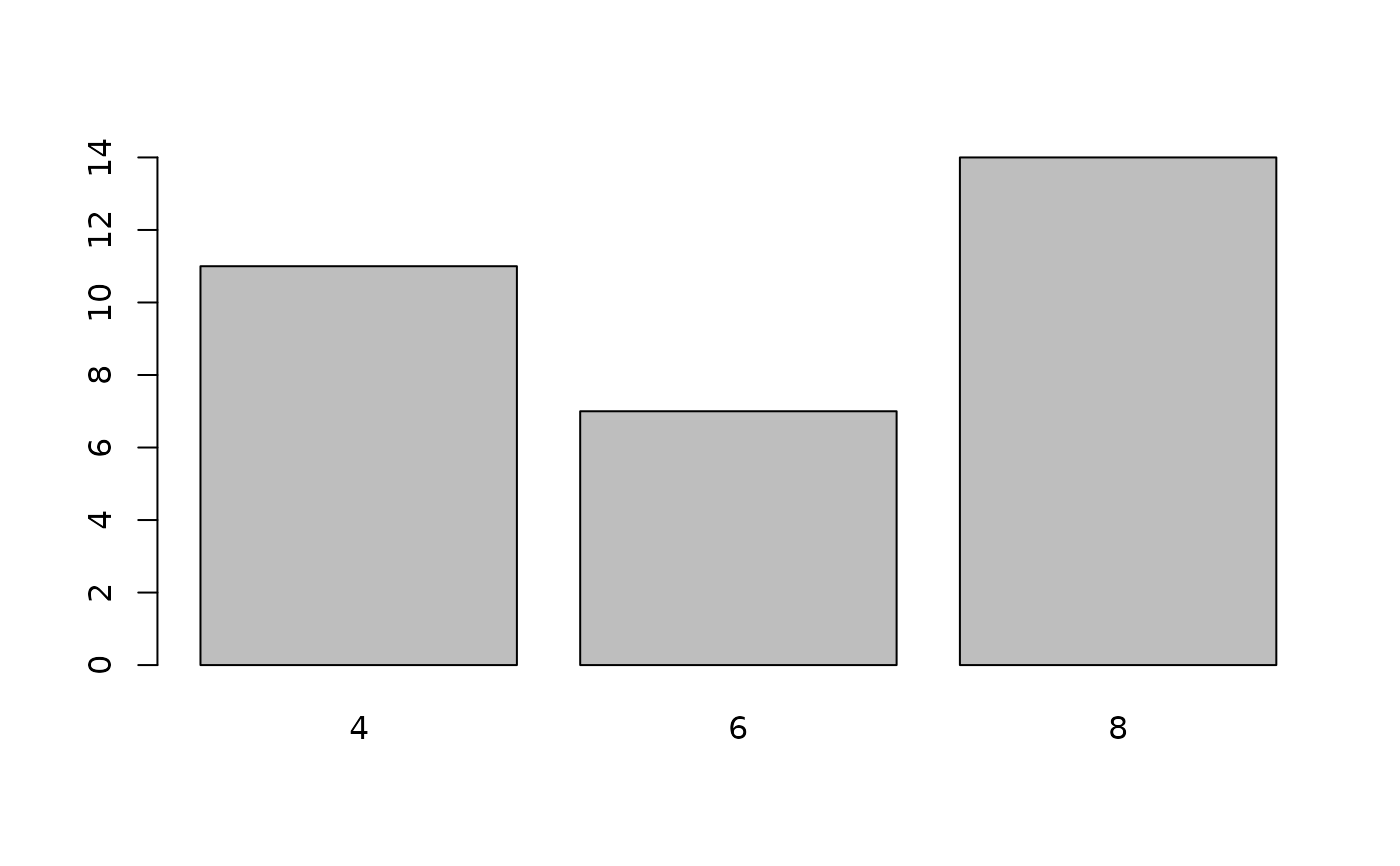
Turns on the accessible rendering of ggplot2, lattice and Base R plots.
It is on after library(maidr): maidr_on() is needed only to turn it
back on after maidr_off().
Details
Interception is on by default after library(maidr): printing a ggplot2
or lattice object opens it in the MAIDR viewer, and Base R plotting calls
are recorded until show() is called. lattice is reached through its own
hook, lattice.options(print.function = ), which maidr sets once lattice's
namespace is loaded; a print function set before is kept, and draws the
prints maidr leaves to lattice.
In an R Markdown or Quarto document, library(maidr) is enough: loading
maidr during the knit, or else the first chart the document draws,
installs the knitr hooks that make every plot of it an accessible chart,
in each render of a session. So any document rendered in a session where
maidr is loaded, even only its namespace (as a package that imports maidr
loads it), gets charts, whether or not it loads maidr itself;
options(maidr.auto_show = FALSE) before the render prevents that. In a
document, maidr_on() installs the hooks at once.
In HTML output the charts are part of the page, which loads maidr.js once
for all of them, and the static figures of a chunk are recorded with
svglite rather than knitr's default png (maidr.knitr_dev in
maidr-options turns that off). A chunk can draw several charts –
print(p) in a loop, several Base R charts – and each takes the place of
its own figure; a figure maidr cannot read as one chart stays knitr's
image. HTML that cannot hold a chart in the page, such as an HTML
fragment or pagedown, shows each chart in a frame of its own. In PDF,
Word, Markdown, EPUB or xaringan output the plots are knitr's figures, as
without maidr. A chart a document returns or prints never opens the
viewer; an explicit show() still does, during the render, and puts
nothing in the page.
A chart is drawn at its chunk's fig.width and fig.height, in inches,
as knitr draws the chunk's figures: fig.asp and fig.dim set them as
they do for a figure, and so do R Markdown's fig_width and fig_height
and Quarto's fig-width and fig-height. html_document and Quarto's
HTML formats draw figures at 7 x 5 in, maidr's own size outside a
document. A format with a figure size of its own draws its charts at
that size: rmarkdown::html_vignette at 3 x 3 in, small enough that a
Base R chart shows fewer tick labels, ioslides at 7.5 x 4.5 in, slidy at
8 x 6 in and knitr::knit() on its own at 7 x 7 in. Set fig.width and
fig.height to draw a chart at another size.
A chart is shown at the size knitr shows the chunk's figure: fig.width
times dpi over fig.retina pixels wide for a retina figure, 96 pixels
to the inch in R Markdown's and Quarto's HTML, where knitr's figures are
png at dpi = 96 and fig.retina = 2; a pixel to a dot for any other
bitmap; and at the size its file gives an svg figure, 96 pixels to the
inch for svglite's and 72 for R's svg() with Cairo 1.18 (Quarto's
fig-format: svg). So dpi, Quarto's fig-dpi, changes it as it
changes a figure. Its SVG's viewBox is still 72 to the inch, the
canvas it was drawn on, and what maidr reads out is the same at any
size. show() and save_html() show a chart at 72 pixels to the inch.
A candlestick chart is drawn at least 12 x 6 in. A chunk that sets a
smaller size of its own is told so in a message (see show()): among the
chunk's messages for a ggplot2 chart, and on the console for a Base R
chartSeries() chart, which maidr reads once the chunk has run. The
document's figure size, which the format, its YAML or
knitr::opts_chunk$set() sets for every chunk, was not asked of a
candlestick chart, which is drawn larger than it without a message.
maidr draws a Base R chart again from its recorded calls, with the
margins and text size its chunk's par() calls set (mar, mai,
oma, omi, mex and cex), so it fits where R drew it. A chart R
drew in its chunk with settings maidr does not record – a par() called
by name, as graphics::par(), or another of its settings – can still be
too small for its size in maidr. Too small for the document's figure
size, it is drawn larger, as one too small for 7 x 5 in is outside a
document (see show()), and a message on the console names the size.
Too small for a size its chunk sets of its own, it stays knitr's picture,
with a warning naming the size.
Whether a chunk set its size is read from the size, not from where it
was set: a chunk that sets the document's own, fig.width = 7 and
fig.height = 5 in html_document, is taken to set none, for a
candlestick chart and a Base R chart alike.
The size is the room the chart is laid out in, not what a reader hears:
its data, titles and axes are the same at every size, though a lattice
chart conditioned on one variable with no layout = arranges its panels,
and the grid a reader moves through, for it (see show()).
out.width sets the width a chart is shown at, wider or narrower than
its own size, as it does a figure's, and out.height its height, though
a chart keeps its shape where an image is stretched; fig.align aligns
it. In Quarto a captioned chart is centred unless the chunk aligns it, a
percentage out-width in a layout panel is its cell's, and column: screen and its kin stretch a chart across the screen. A chart always
shrinks to fit a page narrower than itself, keeping its shape: Quarto's
fig-responsive: false, which keeps an image from shrinking, is not
read, so that a reader on a phone or with the page magnified need not
scroll sideways through a chart.
In a Quarto reveal.js deck a chart alone on a slide is stretched to the
room left on the slide, as Quarto stretches a lone figure, less the room
maidr's instructions, or a line of its text and its braille field, take
below it, so that they stay on the slide; it is a little smaller than the
figure for that. auto-stretch is read from the document's own front
matter, not from a project's _quarto.yml; a slide marked .nostretch,
a chart given an out-height, one in columns, a panel or a fragment, and
a phone's scroll view are left alone, as Quarto leaves an image. An
ioslides chart too large to leave that room on its slide is made smaller.
In a Quarto dashboard a chart fills its card as an image does, less a
line for maidr's text below it; the card scrolls to maidr's braille and
review fields. The size a chart is given on a slide or in a card does not
change while a reader uses it.
A chart's caption, in R Markdown and bookdown, is plain text: Markdown,
maths and \@ref() in fig.cap are shown as written, and a bookdown text
reference (fig.cap = "(ref:label)") brings them in. fig.show = "animate" stays knitr's animation.
A chunk cached with cache = TRUE brings its charts back from knitr's
cache. One cached with cache = 1 or cache = 2 shows them only when its
code runs: rendered again from the cache, its figures are knitr's static
images, since the charts they were drawn from are not cached with them.
See also
maidr_off() to disable MAIDR rendering